PowerLog Popular


Work the way you want with PowerLog petrophysical software. You drive the order of actions and the amount of guidance provided. Generate models fast. Know where to frac. Work on thousands of wells with data located anywhere in the world, as an individual or as part of a team. PowerLog is truly multi-well and multi-user, providing a powerful well log interpretation environment. Faster and easier than ever, PowerLog does the heavy lifting so you get more work done.
Well Log Petrophysical Analysis
PowerLog® is used every day by petrophysicists, geologists, reservoir engineers and others involved in oil field appraisal and development.
"With its user programming, data editing, multi-well interpretation and batch processing capabilities considered, PowerLog is perhaps the best value-for-the-dollar of any formation evaluation software product on the market today." - Paul Connolly, Chief Petrophysicist, EOG Resources Houston
Powerful Petrophysical Collaboration
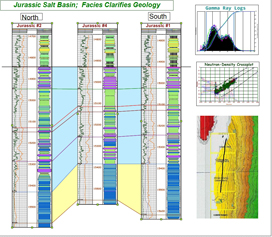
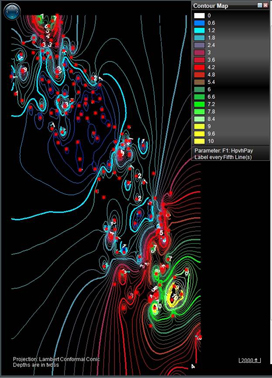
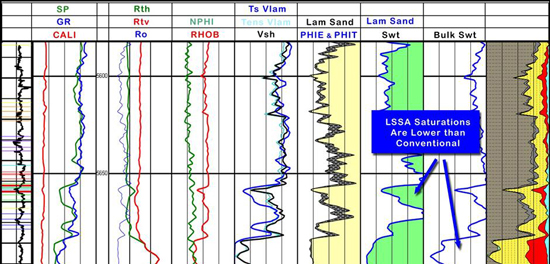
Efficient multi-user functionality lets your petrophysicist analyze logs, your geologist pick tops and your engineer create zones. PowerLog helps you locate pay zones in each well and understand how the reservoir connects across the field. Greater insight into porosity, water saturation, capillary pressure, and other key indicators help reveal a field’s potential.
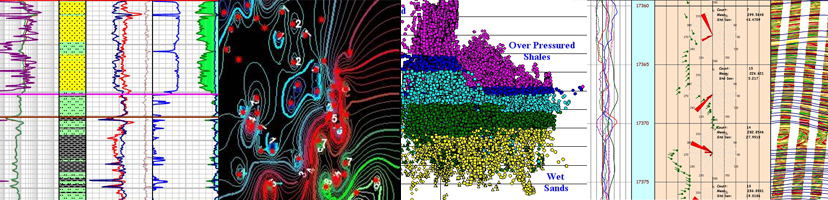
Extremely portable, PowerLog can be used anywhere and powerful visuals get the point across for quick collaboration on important drilling decisions. Colleagues around the globe can share and interpret data for streamlined work effort and peer reviews.
Fast Petrophysical Analysis
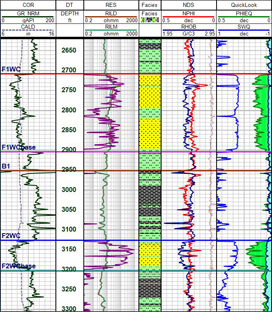
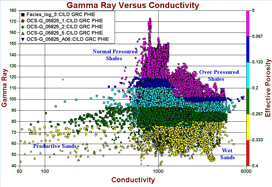
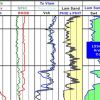
Petrophysical analysis by its very nature is a highly visual process. When you see a problem in a logplot or histogram, it makes sense that you would want to make a correction right there. PowerLog makes it easy for you to do just that. All changes are immediately reflected everywhere the affected data appears.
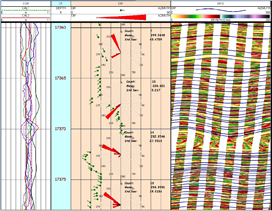
When viewing a logplot, for example, you may see a need to make a depth shift. All you need to do is select editing mode and make your adjustment. This is very fast and completely logical.
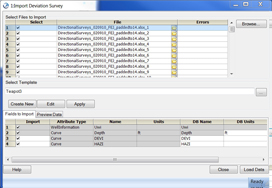
Normalization is another change that is easily made through either the crossplot or histogram. For example, if the calibration was off in one well, you can fix it with a bulk shift or gain and offset. PowerLog petrophysics software supports dual interval display during multi-well editing—you simply identify a soft interval and a hard interval and use them to calibrate the entire log. PowerLog can even auto-normalize if you have a series of wells that require the same fix.
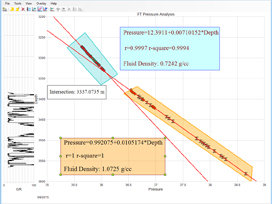
As a final example, the Synthetic Curve Generator allows you to predict curves in wells where data is missing and to automate bad-data editing. For a curve that has problems, select a good section and PowerLog uses linear regression analysis to fix the problem. PowerLog outputs the equations,
Rating
Visits
2,965
Redirects
550
Don't Miss Out! Get the Best Deal on this Software - Email Us Now!